Capturing Data in a Signal Flow Diagram
When a node is dragged onto the Signal Flow Diagram, it subscribes to receive events either through GOOSE or Reports. This is based on the data retrieval method that is selected as described in the previous section. From this point forward, the diagram actively displays the current value and quality of the attributes (provided there is an active connection). The diagram also displays the connection status of the client to the server.
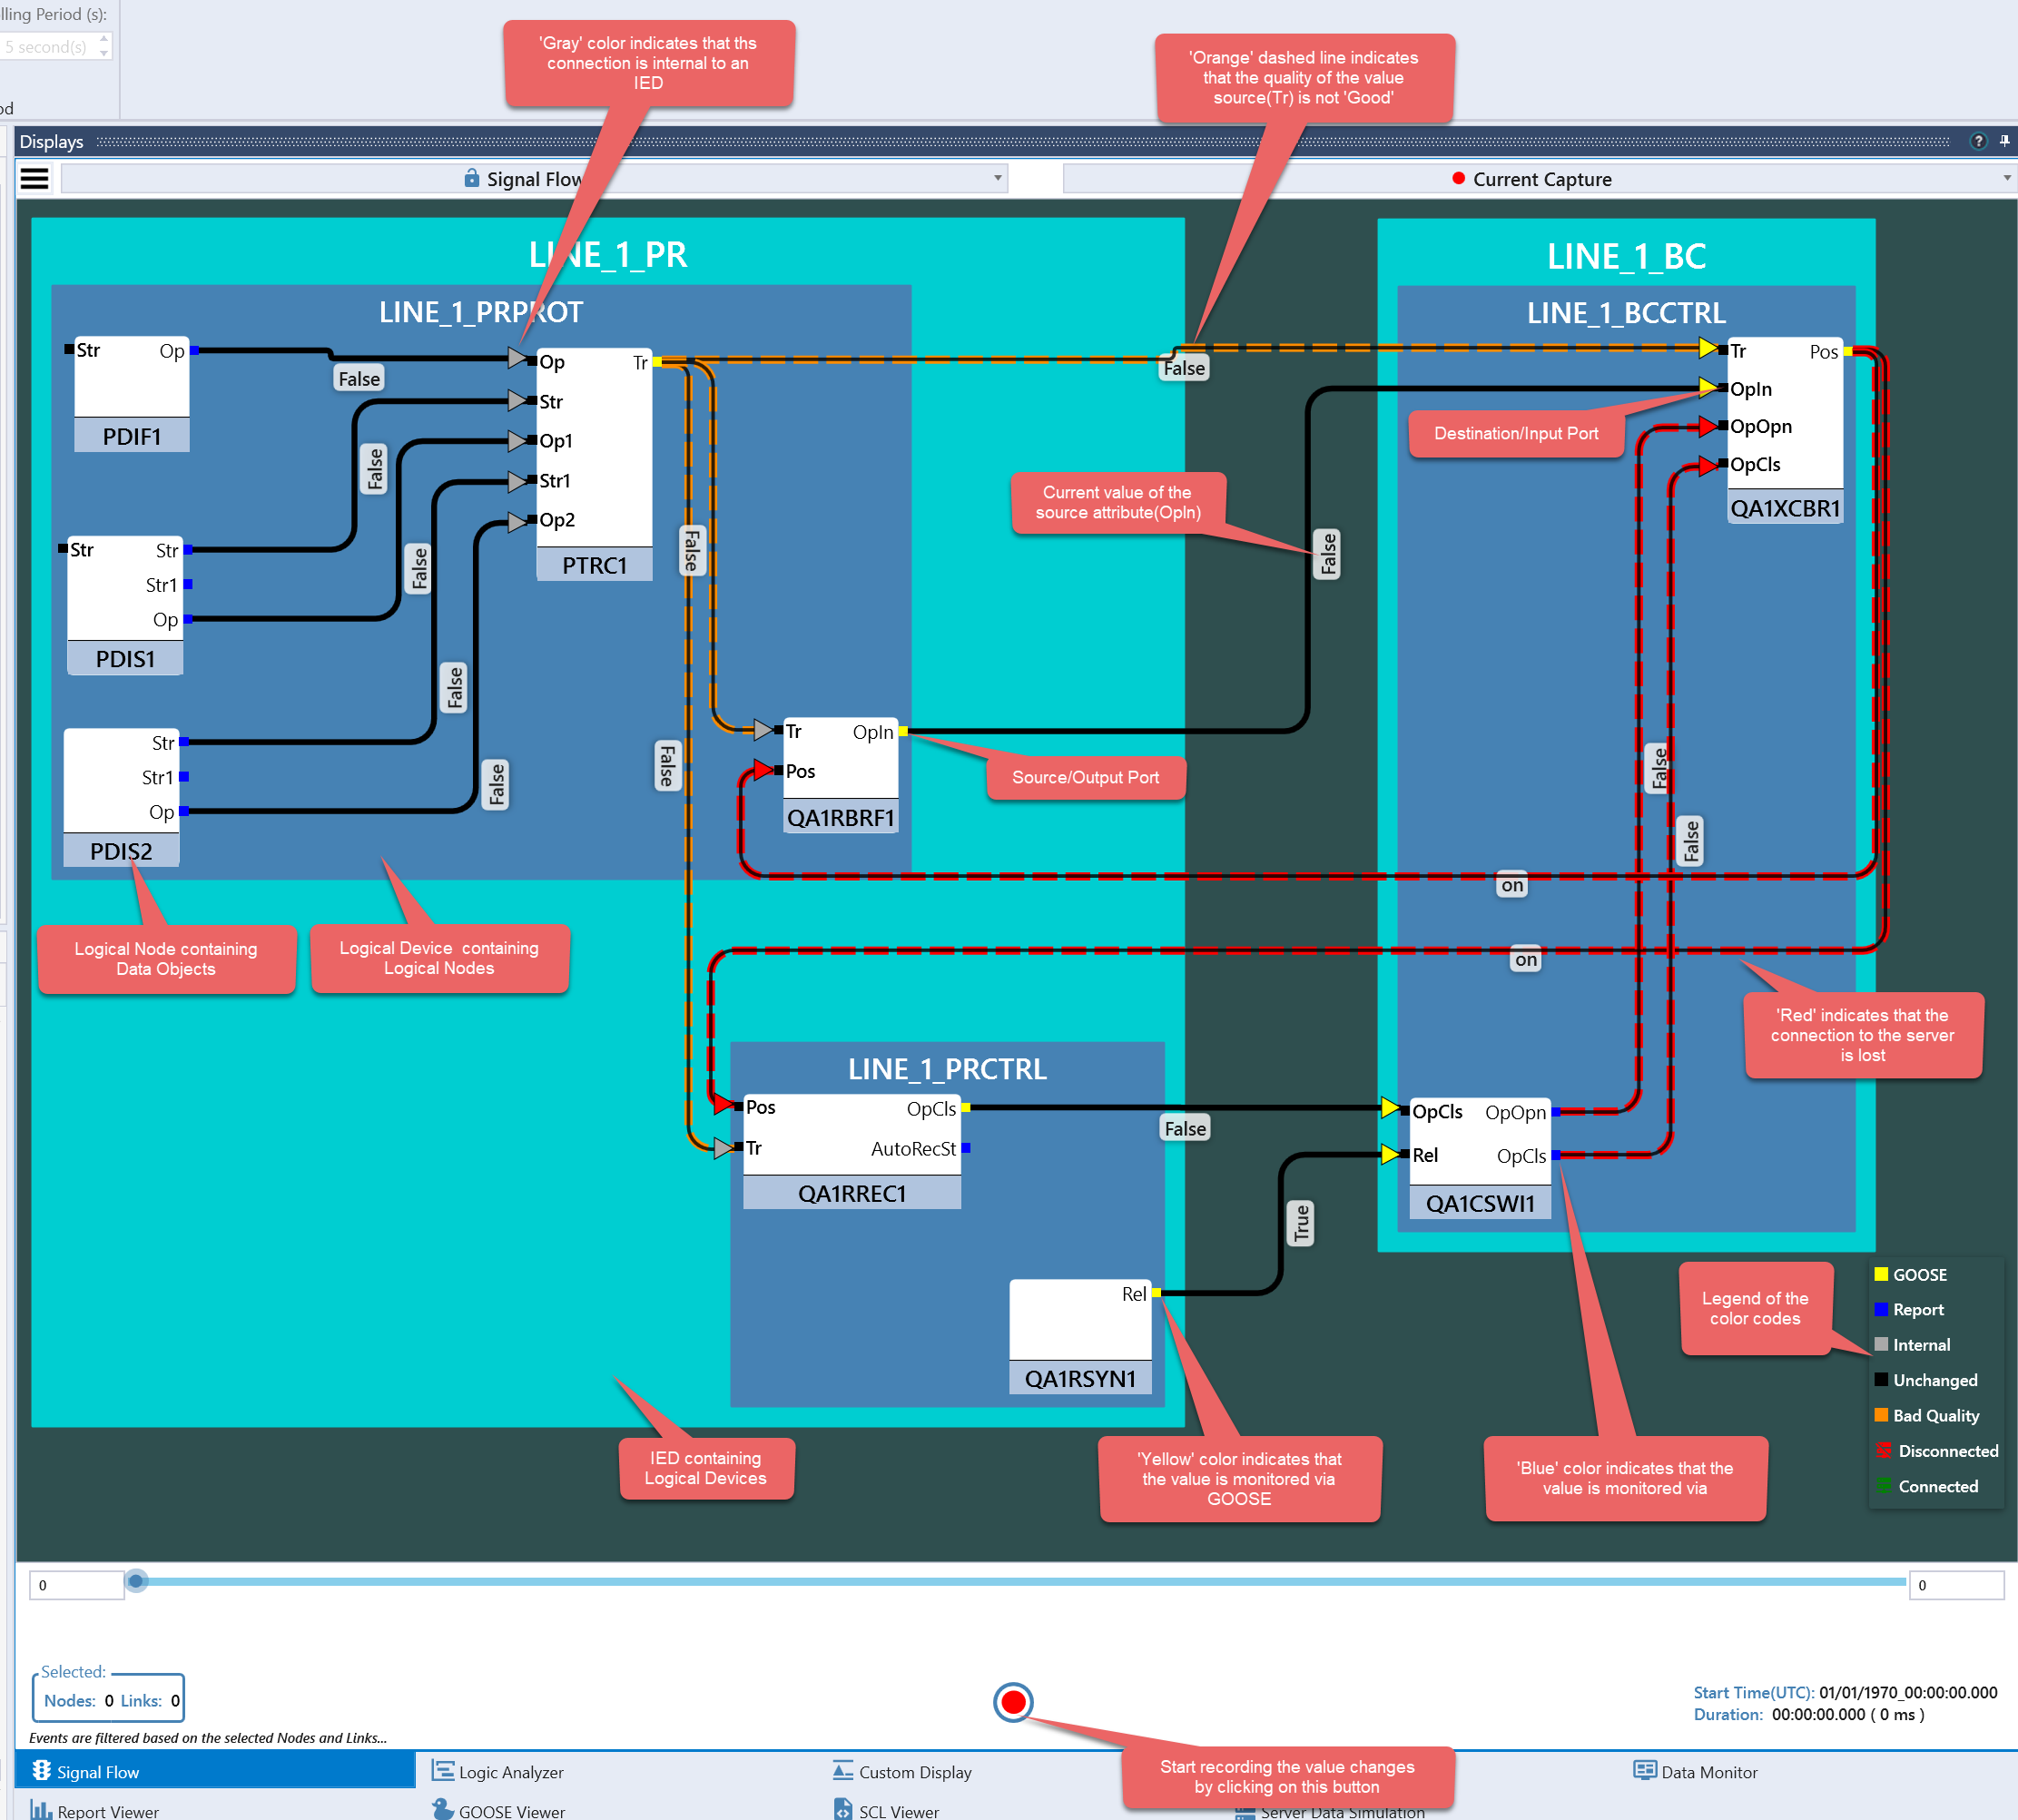
The diagram above displays a Signal Flow Diagram and its various components. Different visualizations and color codes are used to differentiate between the connection status, data retrieval methods and the quality of the signals. As shown, multiple data objects corresponding to one logical node can be dragged over and they are automatically grouped by Logical Node -> Logical Device -> IED. The node that is being dragged over will be the source and will be placed on the right side of the Logical Node. If the dragged node has external references, the dependent nodes are automatically added, and links are drawn between the source (dragged node) and the destination (External References). The source will therefore behave as an Output port and the destination will behave as an Input port for a logical node.
Besides being able to display the current condition of the signals, the display also lets the user record the events as they occur. On pressing the ‘Record’ button, the display will start to collect all value changes and plot them on a timeline with millisecond accuracy. The following screenshot provides details of the recording:

Transitions added on the Logical Nodes and the Links between them help visualize a signal flowing from source to destination. The events are tagged on the timeline with a number that indicates the sequence in which they occurred.